Customer Insights - A market trend observation solution based on invoice data
Project period
take on a role
Visual Design
UI & UX Design
Responsible for the project
Functional process planning, design finalization, engineering delivery, user research
Responsible for the product
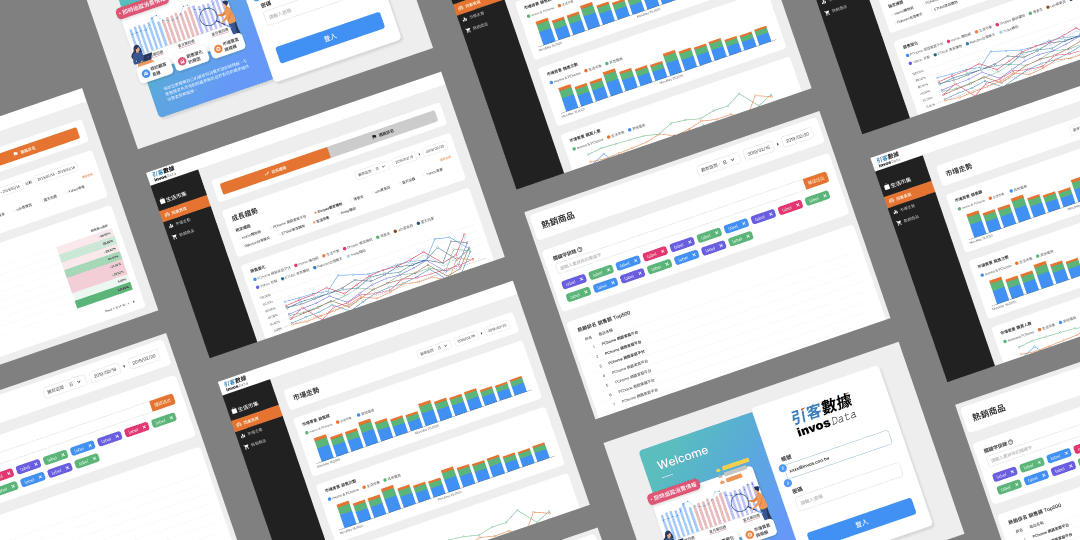
Guest data Invosdata

02
Project Overview
01 Team Goals
Our team wants to provide corporate clients with real-time changes in market trends, assisting them in quickly responding to market changes and offering business decision-making advice.
02 Roles and Outputs
In this project, I closely collaborated with the product manager and three engineers, and I was responsible for the entire UI/UX design process and output. From defining the problem to delivering the final visual design to the engineering team, as well as conducting user interviews and producing reports for the B-side.
03 Project Challenge
There are no direct competitors in the market for reference, and the observational data from different industries vary slightly; we need to learn the know-how of market research and industry observation, while also integrating the observation logic into an easy-to-use data platform module; we need to prioritize producing an MVP to test market reactions in the face of uncertain customer needs.
04 Project Results and Impact
We launched the MVP version within a month, continuously iterating on the product experience based on real customer feedback. In the two years since the product launch, we have signed contracts with over 20 enterprise customers, with several major accounts renewing their annual contracts.
03
Project background
The Invoice Passbook is one of the most popular invoice award apps among users in Taiwan, collecting over 100 million pieces of invoice data every month. How to utilize this invoice data to establish a business model is the highest priority task for the product team.
Actual purchase data can more directly reflect market changes compared to website metrics like conversion rates. Although traditional market research reports contain actual purchase data, the volume is relatively small and the observable range is limited, which can lead to biases in data interpretation. In contrast, the actual purchase data from the Invoice Passbook can meet the market observation needs of different industries by comparing the development of peers and covering a wider range of data. Therefore, it has the opportunity to provide services that other businesses cannot offer in terms of market trend observation and business decision-making recommendations.
Back in 2021, the company began investing resources into product development for the data observation platform. At the same time, it also verified the potential market opportunities for the observation platform through business visits to clients, leading to the first enterprise customer order. However, the company was not familiar with how enterprise users could observe market trends or how to design the platform interface and processes to meet user needs, and there were no direct competing products on the market for reference.
04
Design process
01 Understand the problem and user pain points
Conduct user research to gain a deeper understanding of user needs.
02 Define the problem and objectives
Hold internal workshops to collaboratively define core values with the team.
03 brainstorming solutions
The team proposed hypotheses and brainstormed possible solutions.
04 Experiment Verification Idea
Conduct AB testing on the product for further analysis and
05
Understanding the Problem and
User Pain Points
In the early stages of the project, it is difficult for the product team to directly engage with corporate clients, and the demands are communicated by the sales team. Additionally, there is pressure to deliver products to clients within the scheduled timeline. In situations where the requirements are unclear and the team is not familiar with the relevant fields, the product demands brought back by the sales team need to be broken down. After understanding the potential needs of the clients, these can be organized into a visual interface and logic on the platform.
Customer demand analysis
Understanding changes in market trends and the sales performance of competitors will greatly assist in business decision-making and company revenue!

The customer stated that in the past, when operating marketing activities, the effectiveness of the activities could only be reported through sales data from various channel windows. The data collection after the activities takes a longer time, and it is more difficult to obtain the effectiveness of competing brands' marketing activities. This makes it impossible to know the brand's ranking and positioning in the market for that quarter.
The sources of customer data are quite chaotic, and significant effort will be needed to organize it later. We hope to have a solution that intuitively responds to changes in market trends.
Although it is possible to obtain metrics such as advertising conversion rates through website analysis tools, for business customers, the trend changes in actual purchase data can intuitively reflect market changes, serving as a data basis for business decision-making.
When initiating the case, the company's decision-making level decided to develop towards a data observation platform. However, there are few direct competitors in the market to learn from, and consideration must also be given to the high difficulty of user comprehension regarding the new service, which poses a barrier to entry. After comprehensive consideration, it was decided to reference the operational logic and interface design of website analytics tools, integrating the observational characteristics of actual purchase data and the observational needs of customers, to extend into a real purchase data observation and analysis platform that meets the observational needs of corporate clients.


06
Define the problem
The available information on competing products in the market is limited, making it difficult to effectively determine one’s relative ranking in the market.
Customers can only obtain information about competitors' sales状况 through inquiries, and the information obtained may differ from the actual situation. The data can be prone to delays, and the coverage is too broad, making it difficult to break down into a single item, which is not conducive to customers making decision adjustments.
Users need to spend extra time processing the raw data before it can be used for internal reporting.
Among the business users visited, most mentioned the need for regular monthly and quarterly reports, but the information obtained in the past was mostly raw data presented in report form. This required additional time to reprocess into easily readable visual charts, which involved a significant amount of repetitive work, causing users to have to spend part of their energy managing these tasks.
07
Establish a hypothesis
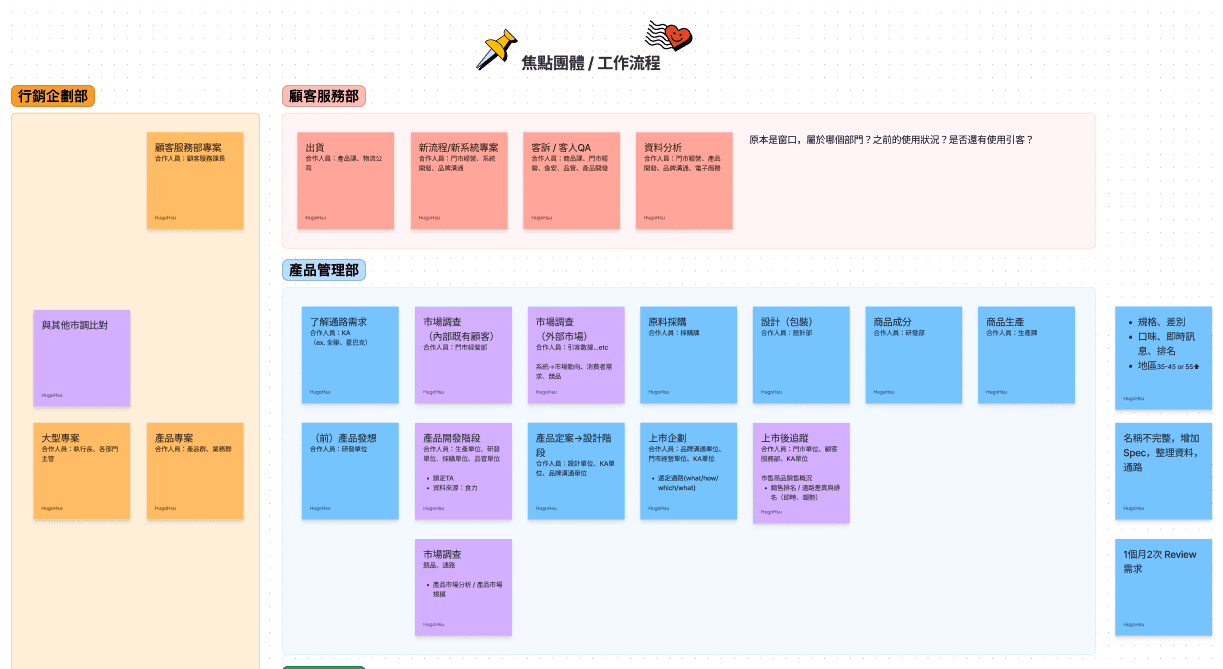
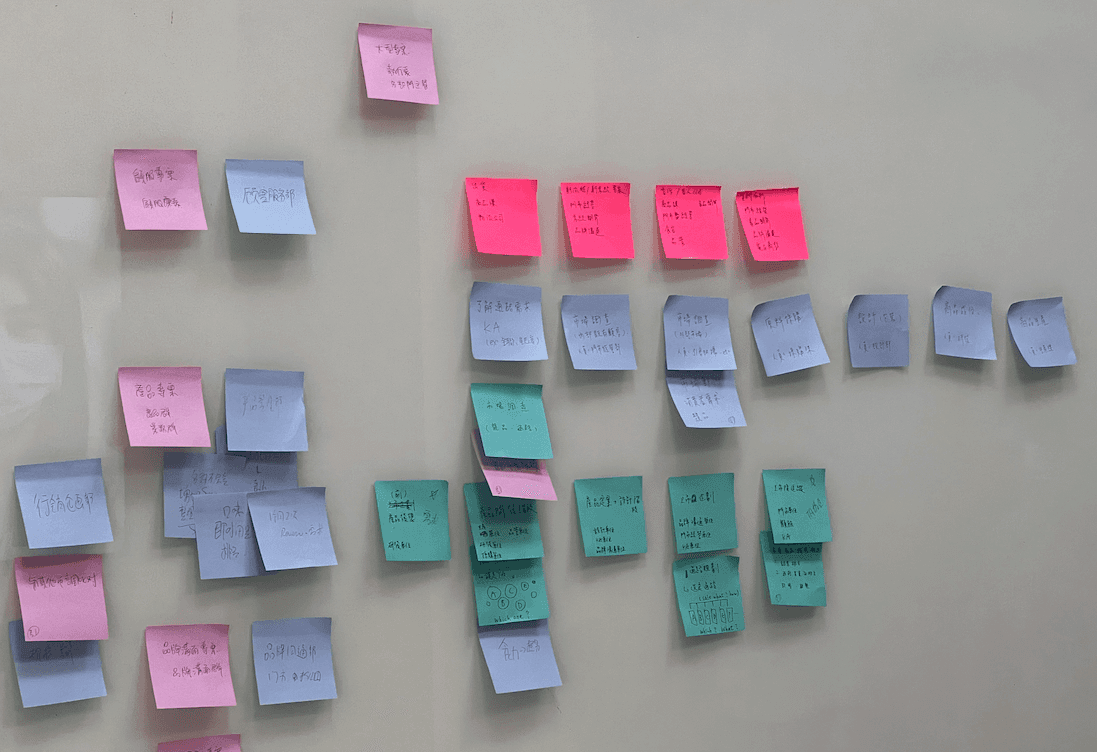
During the two days, the entire team (including product managers, engineers, designers, etc.) worked together to break down the requirements and establish the information architecture. They also discussed project goals, assumptions, constraints, and so on, ensuring that each team member had a consistent understanding of the project.

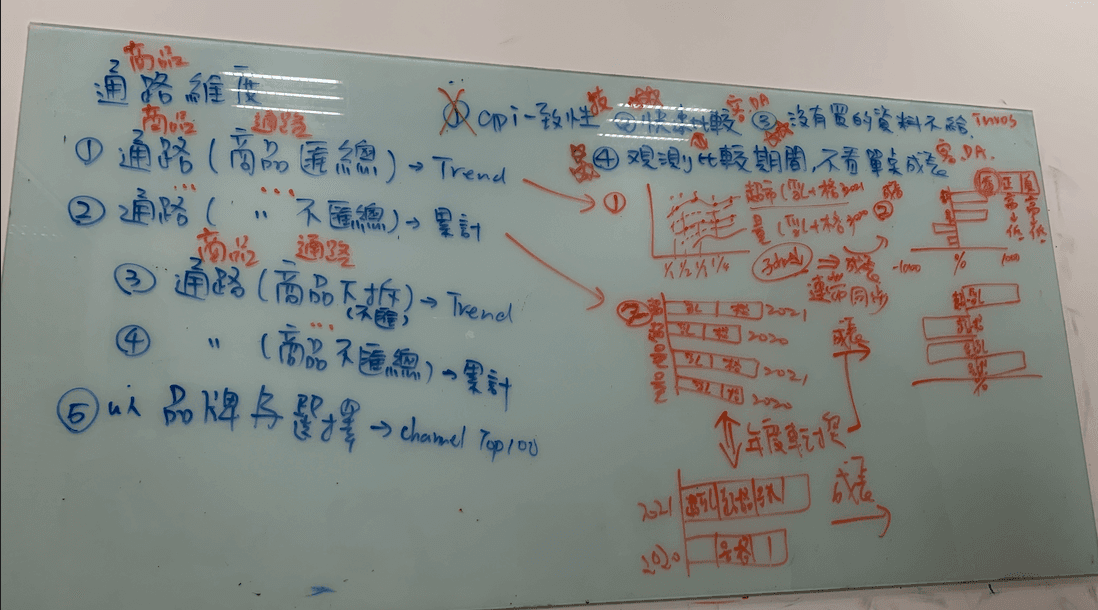
Due to being a product that moves from 0 to 1 and the pressure of the timeline, there are still many unclear aspects regarding user pain points and usage processes. Therefore, we hope to maintain room for flexible expansion of future needs while meeting customer expectations. We discussed many execution details in depth and how to continuously iterate on product services after the first version is launched.

At the end of the design sprint, we produced many concrete ideas and drafts that can effectively help me quickly move into practical design solutions.
Our goal
01
By using interface planning and visual design, clearly structured information is presented to assist clients in completing data analysis tasks.
02
The experience of operating through "Control Panel + Modular Image Blocks" can help customers better obtain the information they want and reduce the operational threshold between different modules.
Challenges and limitations
Limited time
Since our goal is to launch a minimum viable product (MVP) within a month, there is a lot of work to be done in that time. Therefore, the entire team has been closely collaborating throughout the process and prioritizing tasks to ensure we can deliver reasonable outcomes on time.
Technical limitations
Due to schedule pressures, the team proceeded with development without a comprehensive understanding of the market, which led us to conduct a lot of customized process planning and development to meet customer needs, increasing the costs of maintenance and adjustments later on; in addition, there is a lot of complex information and observation dimensions in market research, which are also difficult to achieve in the short term.
08
Project goals
A data observation platform covering multiple categories and brands.
After several discussions within the team, we confirmed the first version's timeline and the technically feasible scope. The direction for this launch is to establish a data observation platform covering multiple items and brands, focusing on providing a one-stop convenient user experience and rich chart content. For users who often pay attention to market changes, the learning curve is lower and better aligns with their usage habits.
1. Explore market opportunities from broad to deep.
By combining customer observations of market demands with the team's experience in tracking data, the essence of real purchase data observation is to identify variables. This involves breaking down the performance of various items and channels from the broader trends, helping customers to react promptly to market changes. Subsequently, the team can use this as a niche point to provide decision-making advice to clients.
2. A screening mechanism for multiple items, multiple brands, and multiple channels.
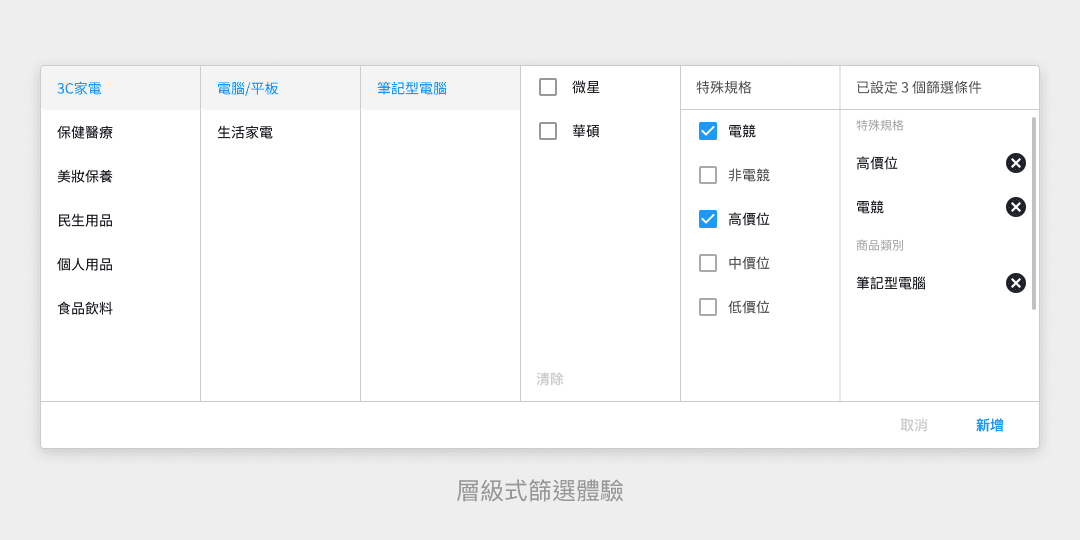
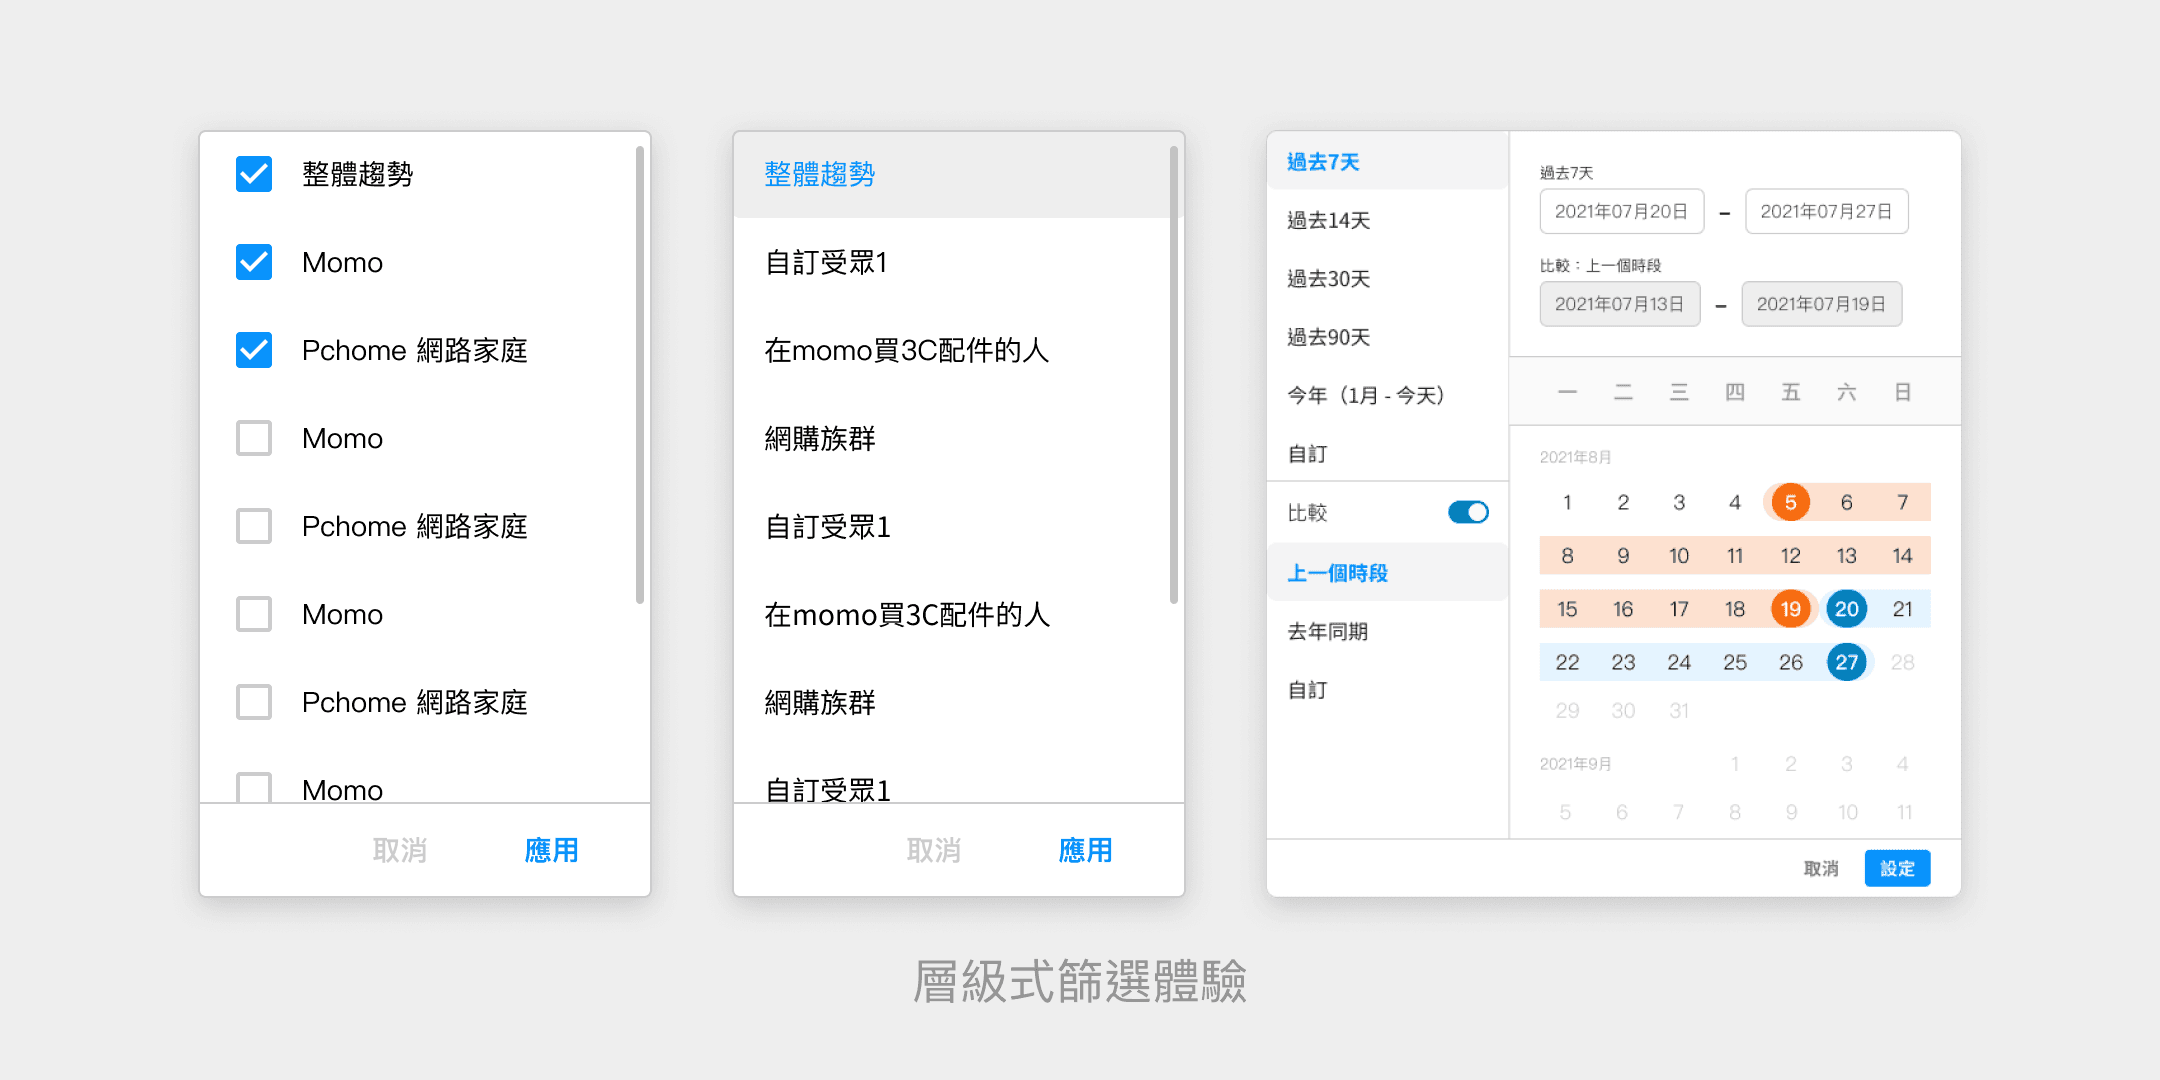
The market observation consists of three elements: "audience, product, and channel." Among them, products and locations can be further divided into major categories, minor categories, major channel types, and channels. Combining broad and deep observation habits, we adopt a hierarchical filtering structure. For example, in terms of products: major category → minor category → brand, combined with the hierarchical structure of channels, it is possible to observe the sales performance of minor products (e.g., yogurt) in major channel types (e.g., large department stores).
3. The flexible architecture of the multi-module ensures flexibility in later iterations.
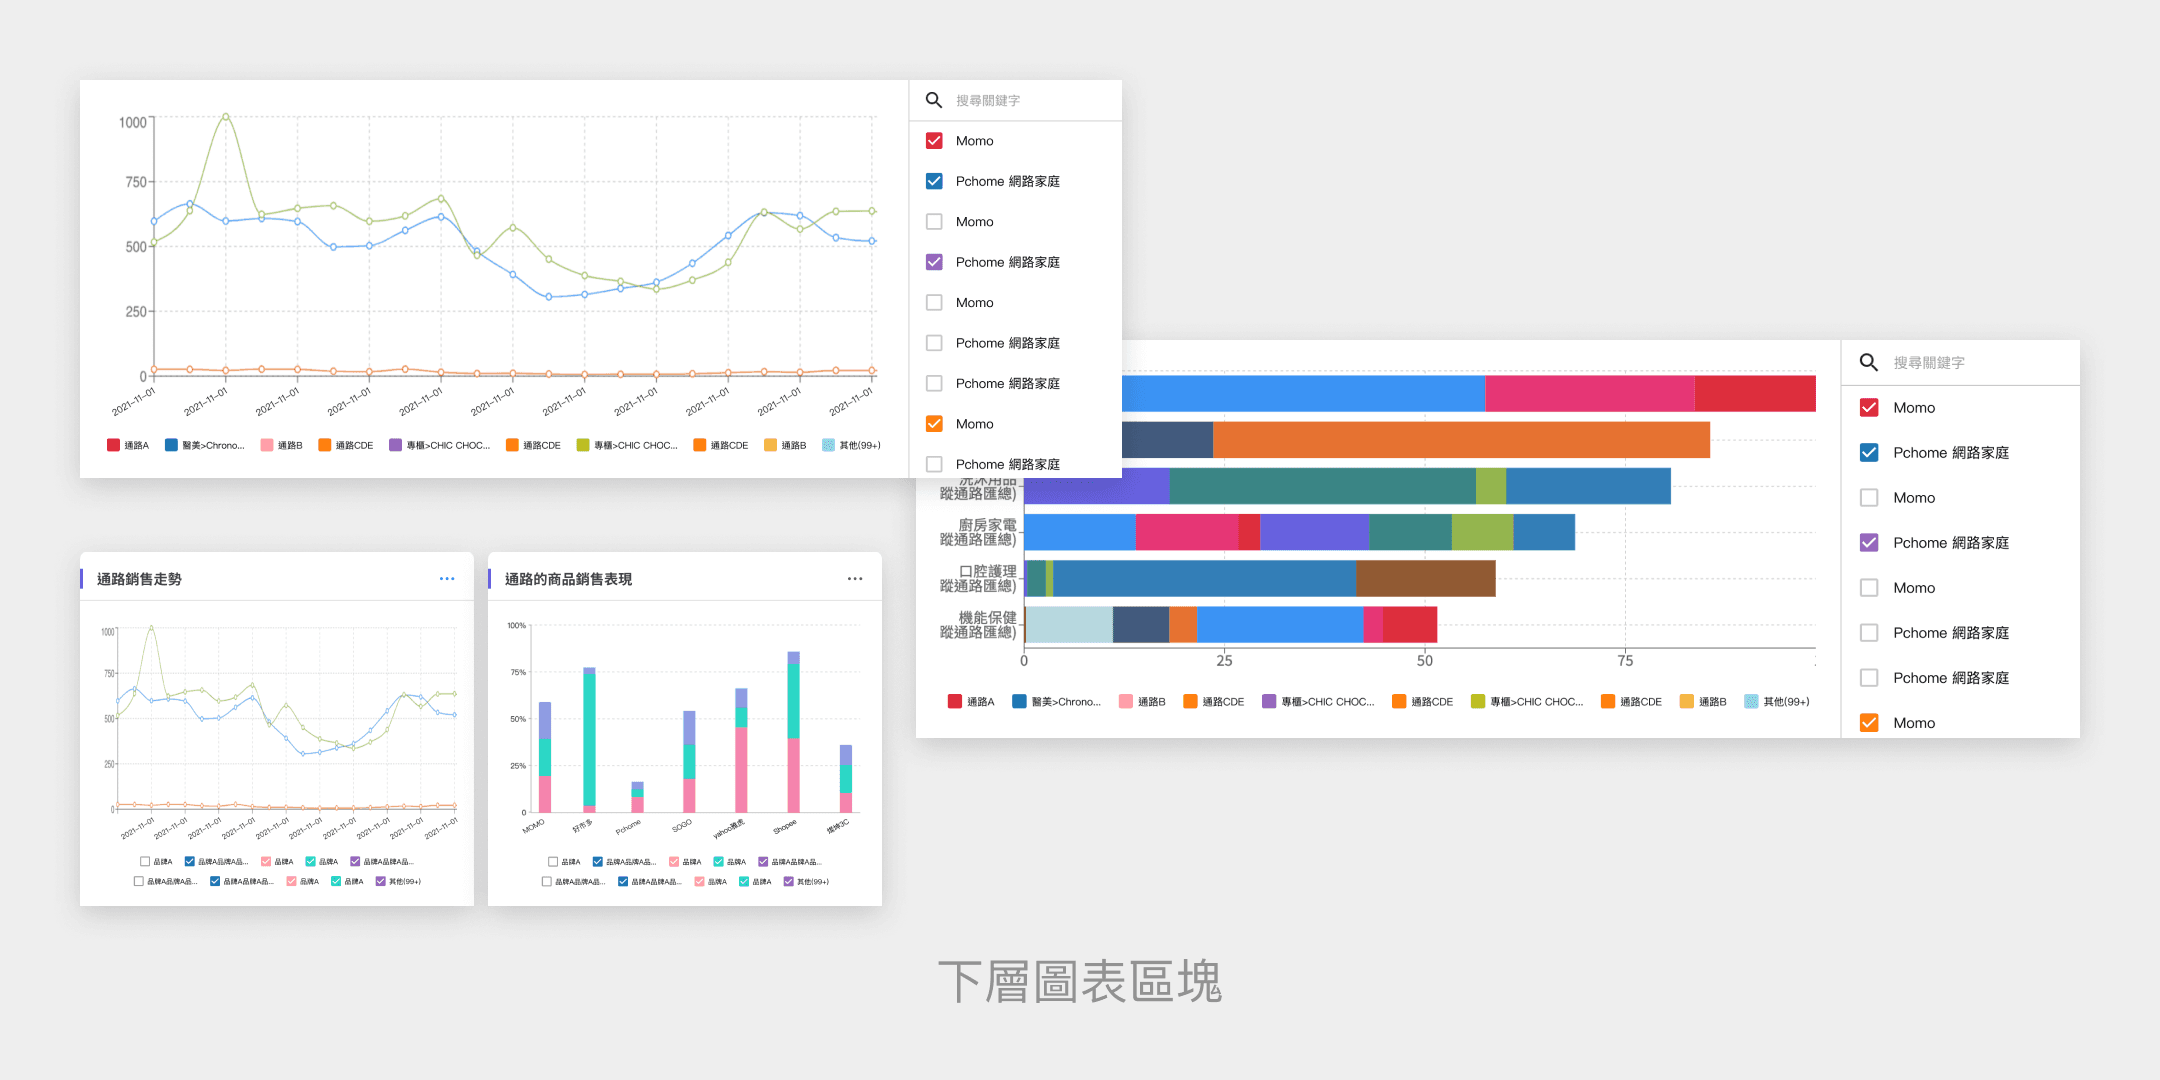
In order to avoid issues such as the page being too long and slow response times due to excessive information, while also ensuring flexibility for future system iterations, the trend observation, audience tracking, and product ranking have been separated into three modules. Furthermore, the most important information from these three modules will be integrated into the Dashboard for exposure, ensuring that users can grasp information in real-time, and they can enter individual modules for further confirmation as needed.
09
design output
Here are the main features we launched in the first version and the subsequent optimizations:
The first version is online.
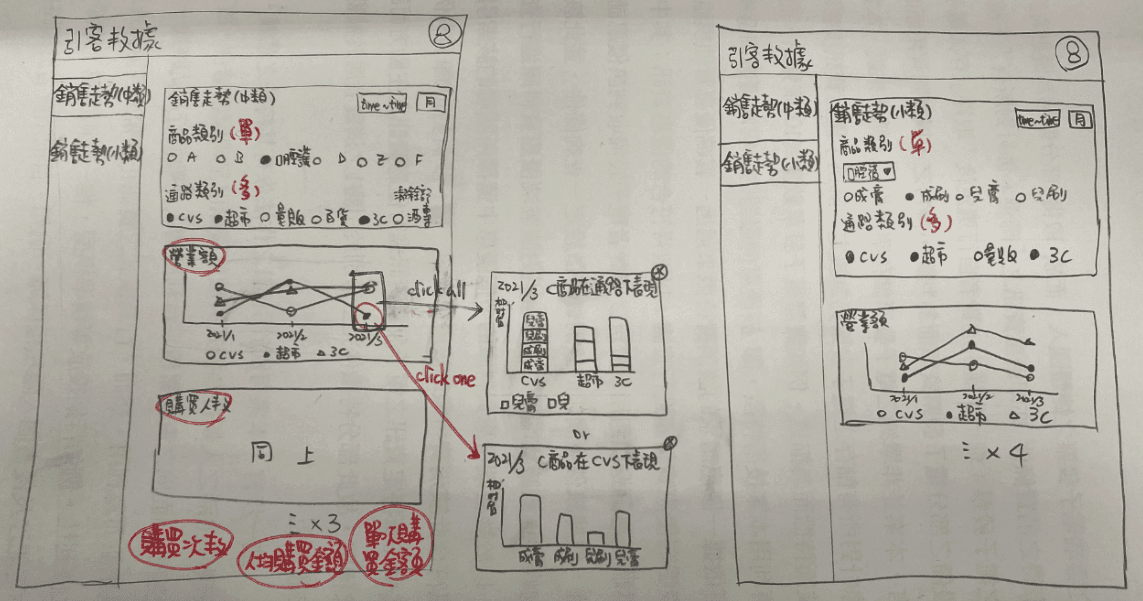
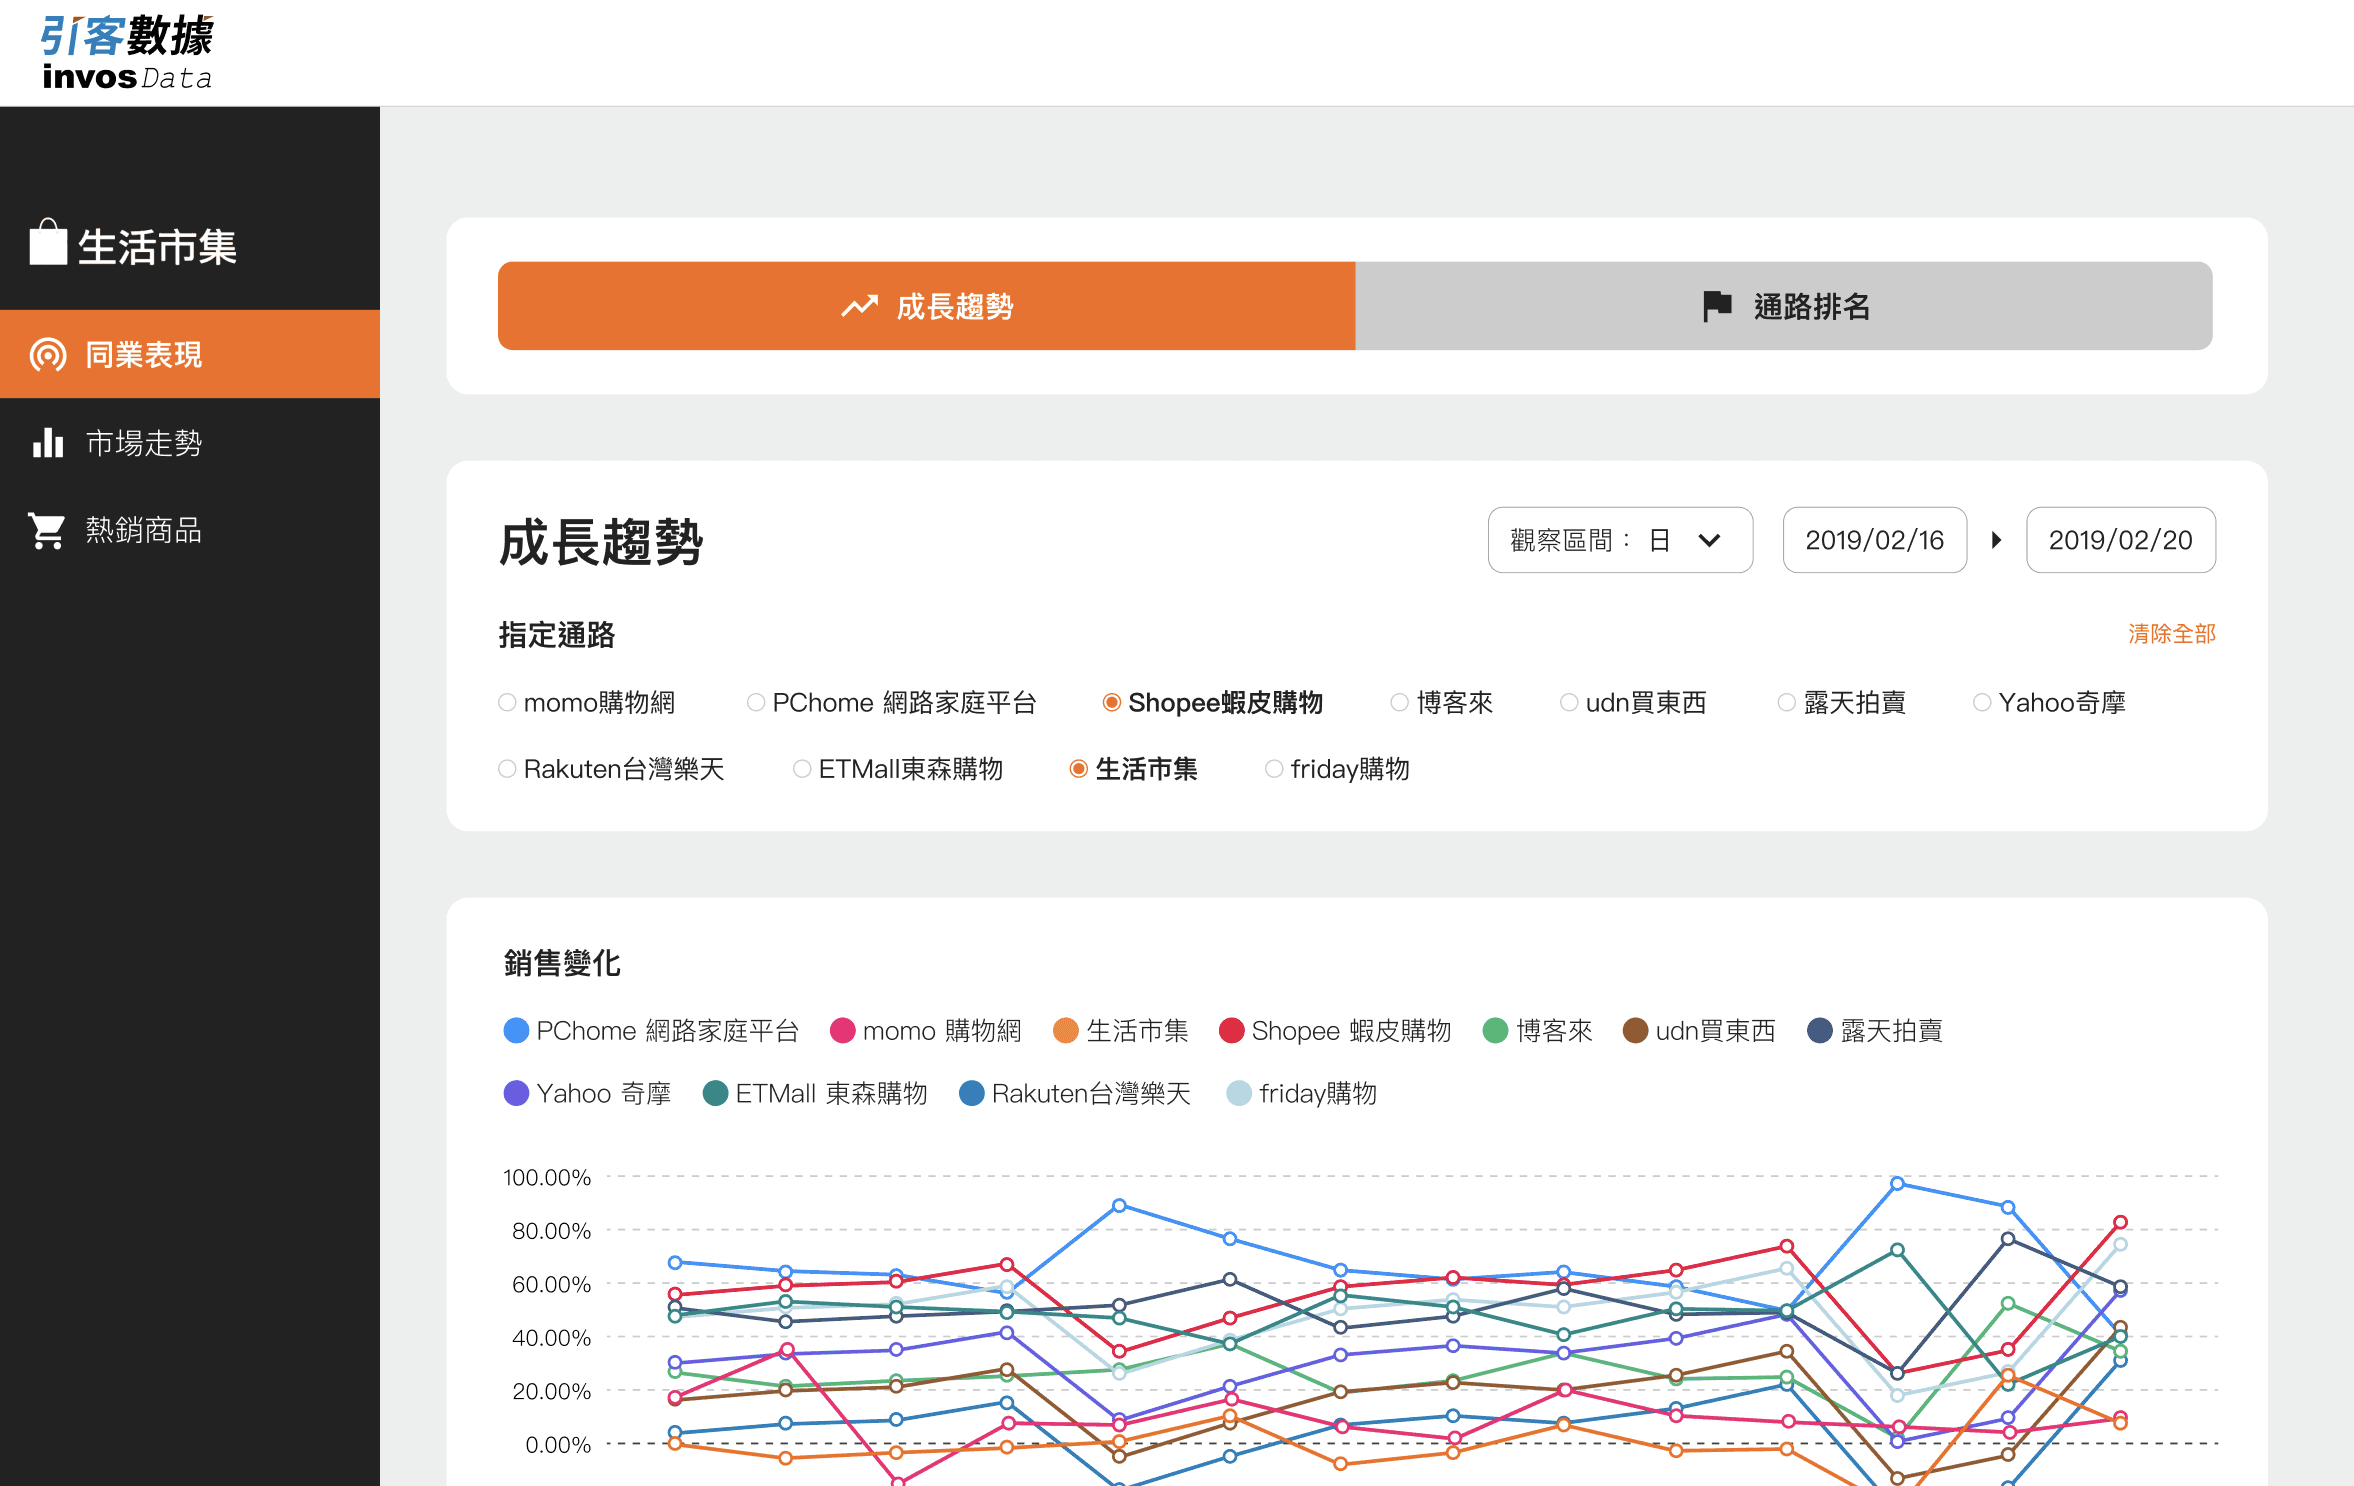
Establish the operation logic of "filter first, then observe," concentrating the filtering action in the control panel, while the charts are presented below as needed. At that time, the client's requirement was to understand the performance differences with competitors and to gain insights into trends/channels/product performance during specific periods; thus, trends/channels rankings are switched through tagSelect, while indicators such as sales are presented using bar charts of market share, and channels are selected through a multi-select approach.
However, shortly after the first version was delivered, many problems arose. The channels/items/areas that needed to be observed kept increasing, and the current arrangement could not meet the demands. Additionally, due to the large amount of data, the system's response speed was slow, making it impossible to further manipulate the chart results or the filtering range, requiring a reset for each operation, which was time-consuming and cumbersome. Therefore, one month after the launch, it was decided to optimize the interface and processes to address the above pain points.
Second edition optimized
Hierarchical filtering experience: Define the observation scope
Users tend to observe the market from a broad to a deep perspective, starting from categories to specifications, from different channels to specific channels, discovering potential business opportunities and risks in the process. Therefore, when planning the second version of the dashboard, the structure was changed to a dropdown menu and a hierarchical structure, categorizing into large, medium, and small brands, ensuring that users from different industries can share components to meet various observation needs.
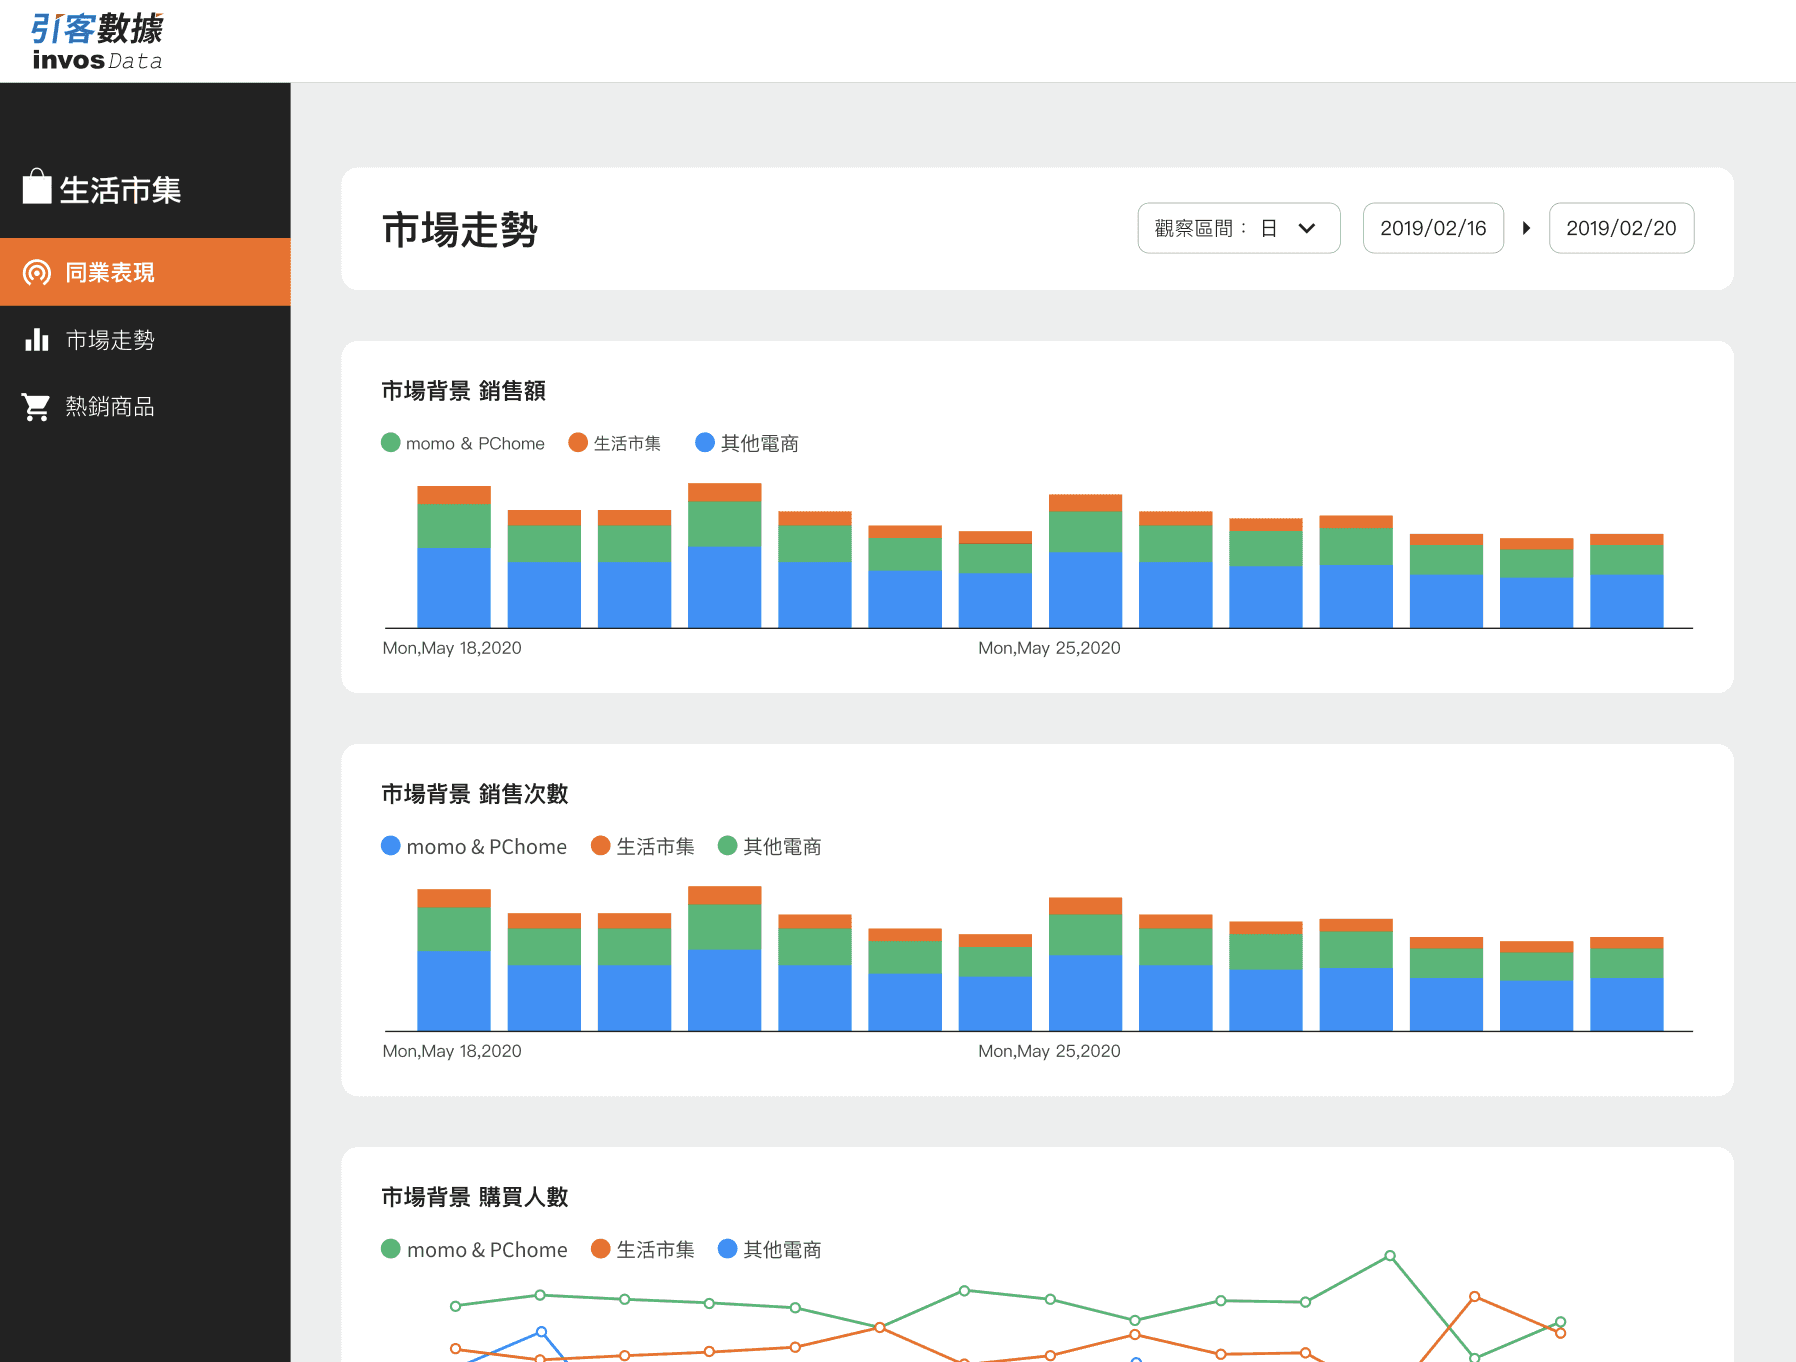
Control panel for dealing with complex situations: Define the scope of observation
In order to allow users to perform most filtering actions when entering the module, the main controller is fixed at the top, while the lower section focuses on presenting content. At the same time, this lower section provides fine-tuning options to maintain flexibility without requiring users to return to the top controller every time. Common observation metrics, such as sales revenue, are presented using tag selection for easy switching by users.

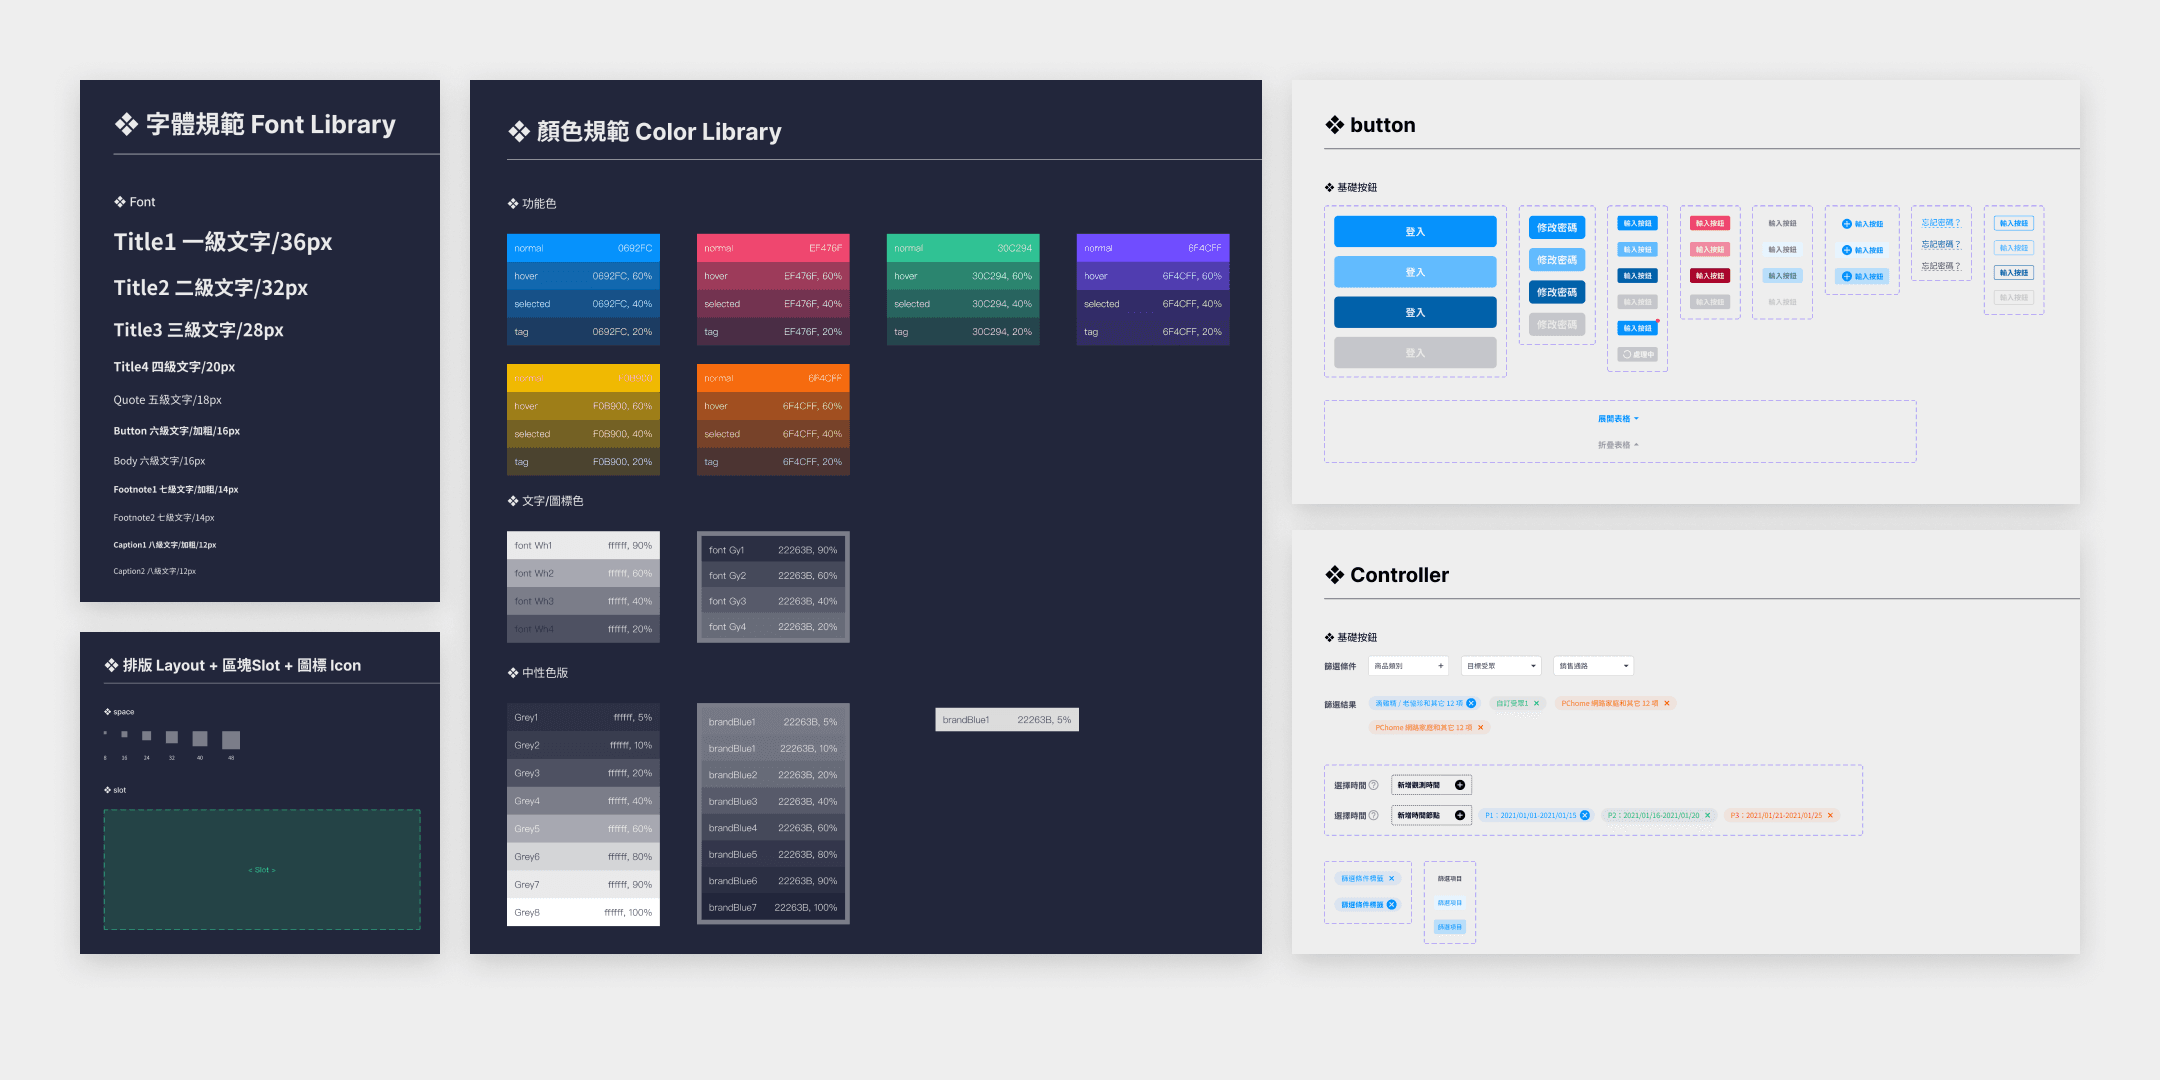
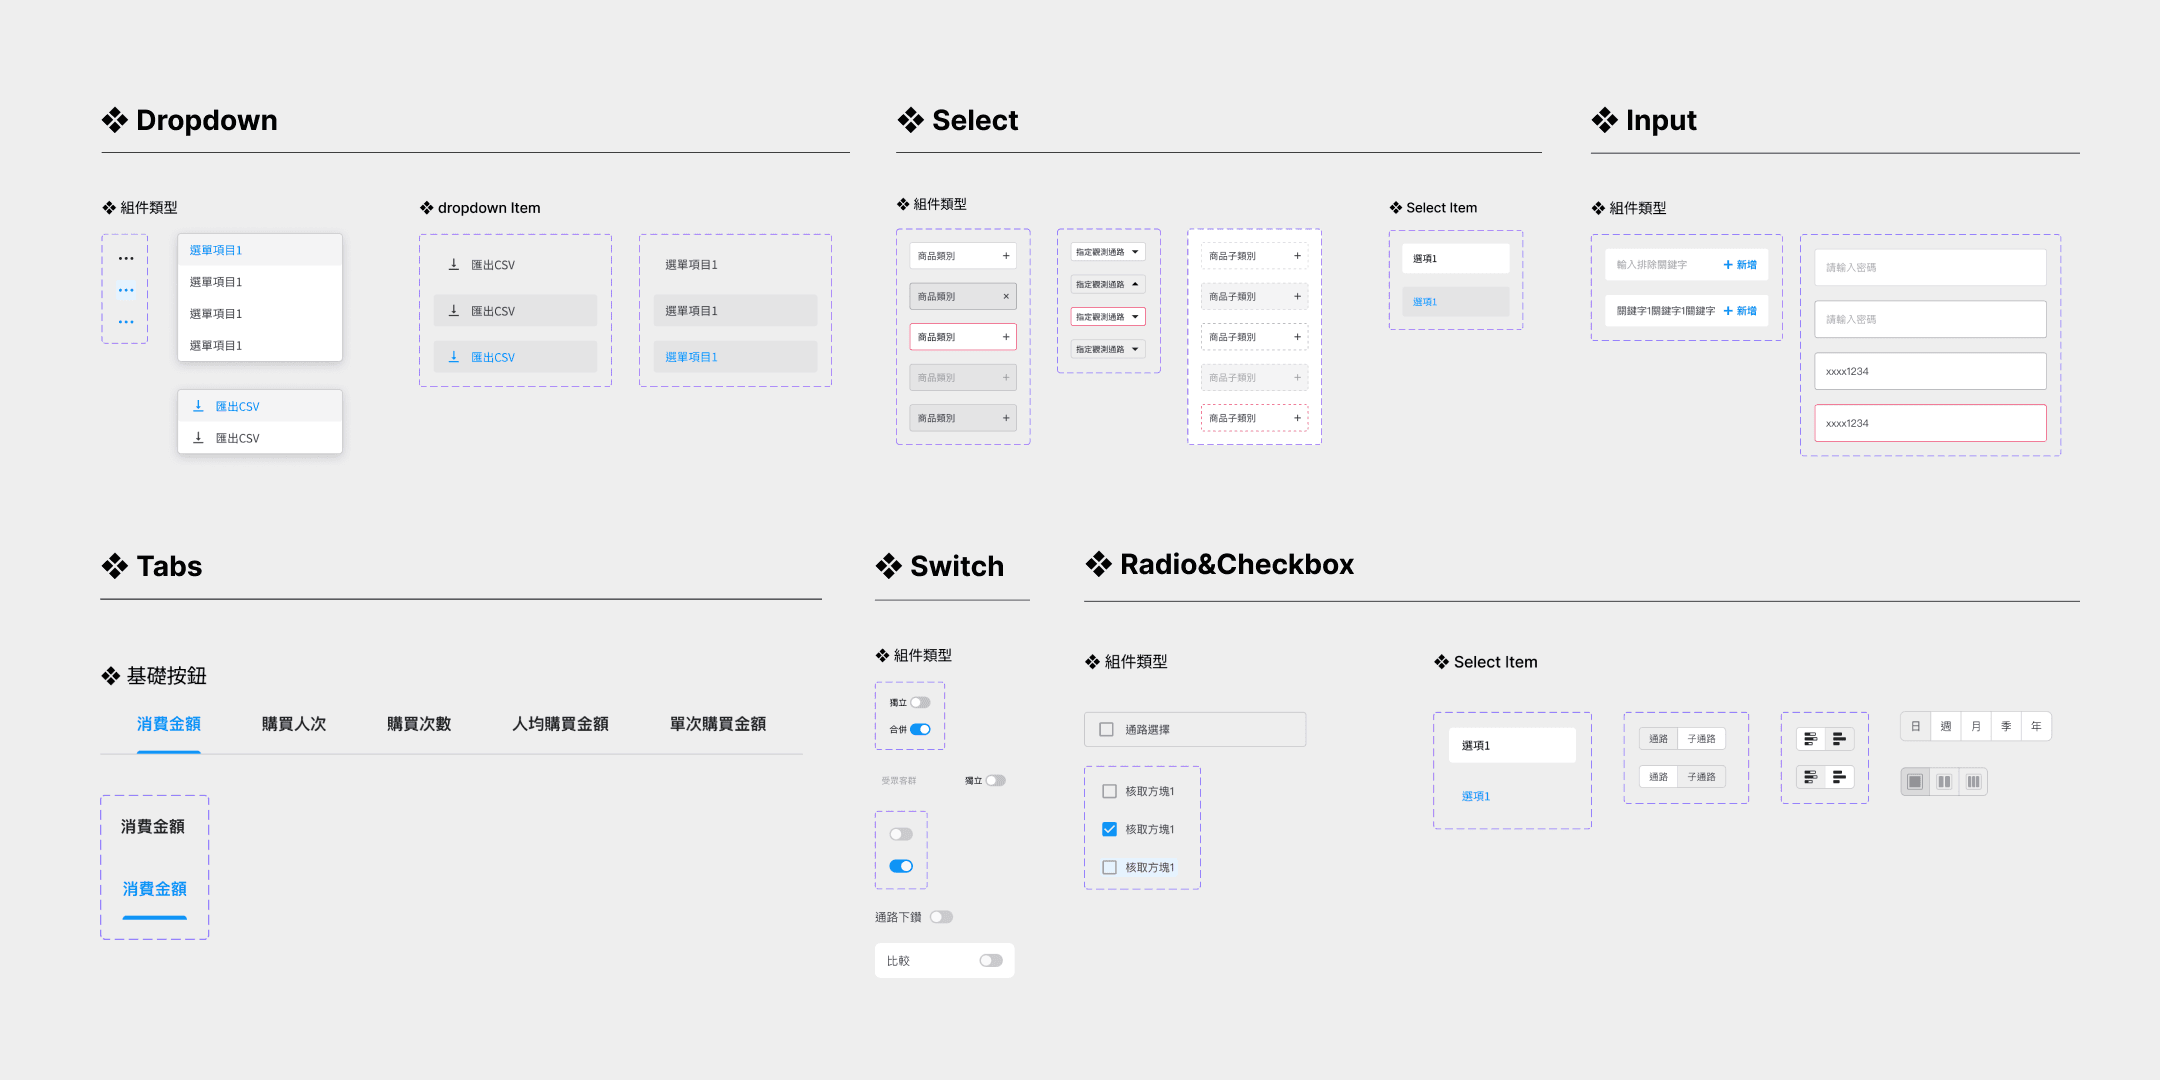
Establishing a Design System ensures consistency in the user interface.
With the increase of functional modules, due to the lack of unified specifications, there have been inconsistencies in user experience among the modules, and numerous issues such as duplicative components on the engineering side. Therefore, in addition to basic specifications such as font color, operational logic and specifications among components and modules have been established to ensure that reusable components are available on the engineering side most of the time, rather than having to develop new components from scratch each time.
10
Project results
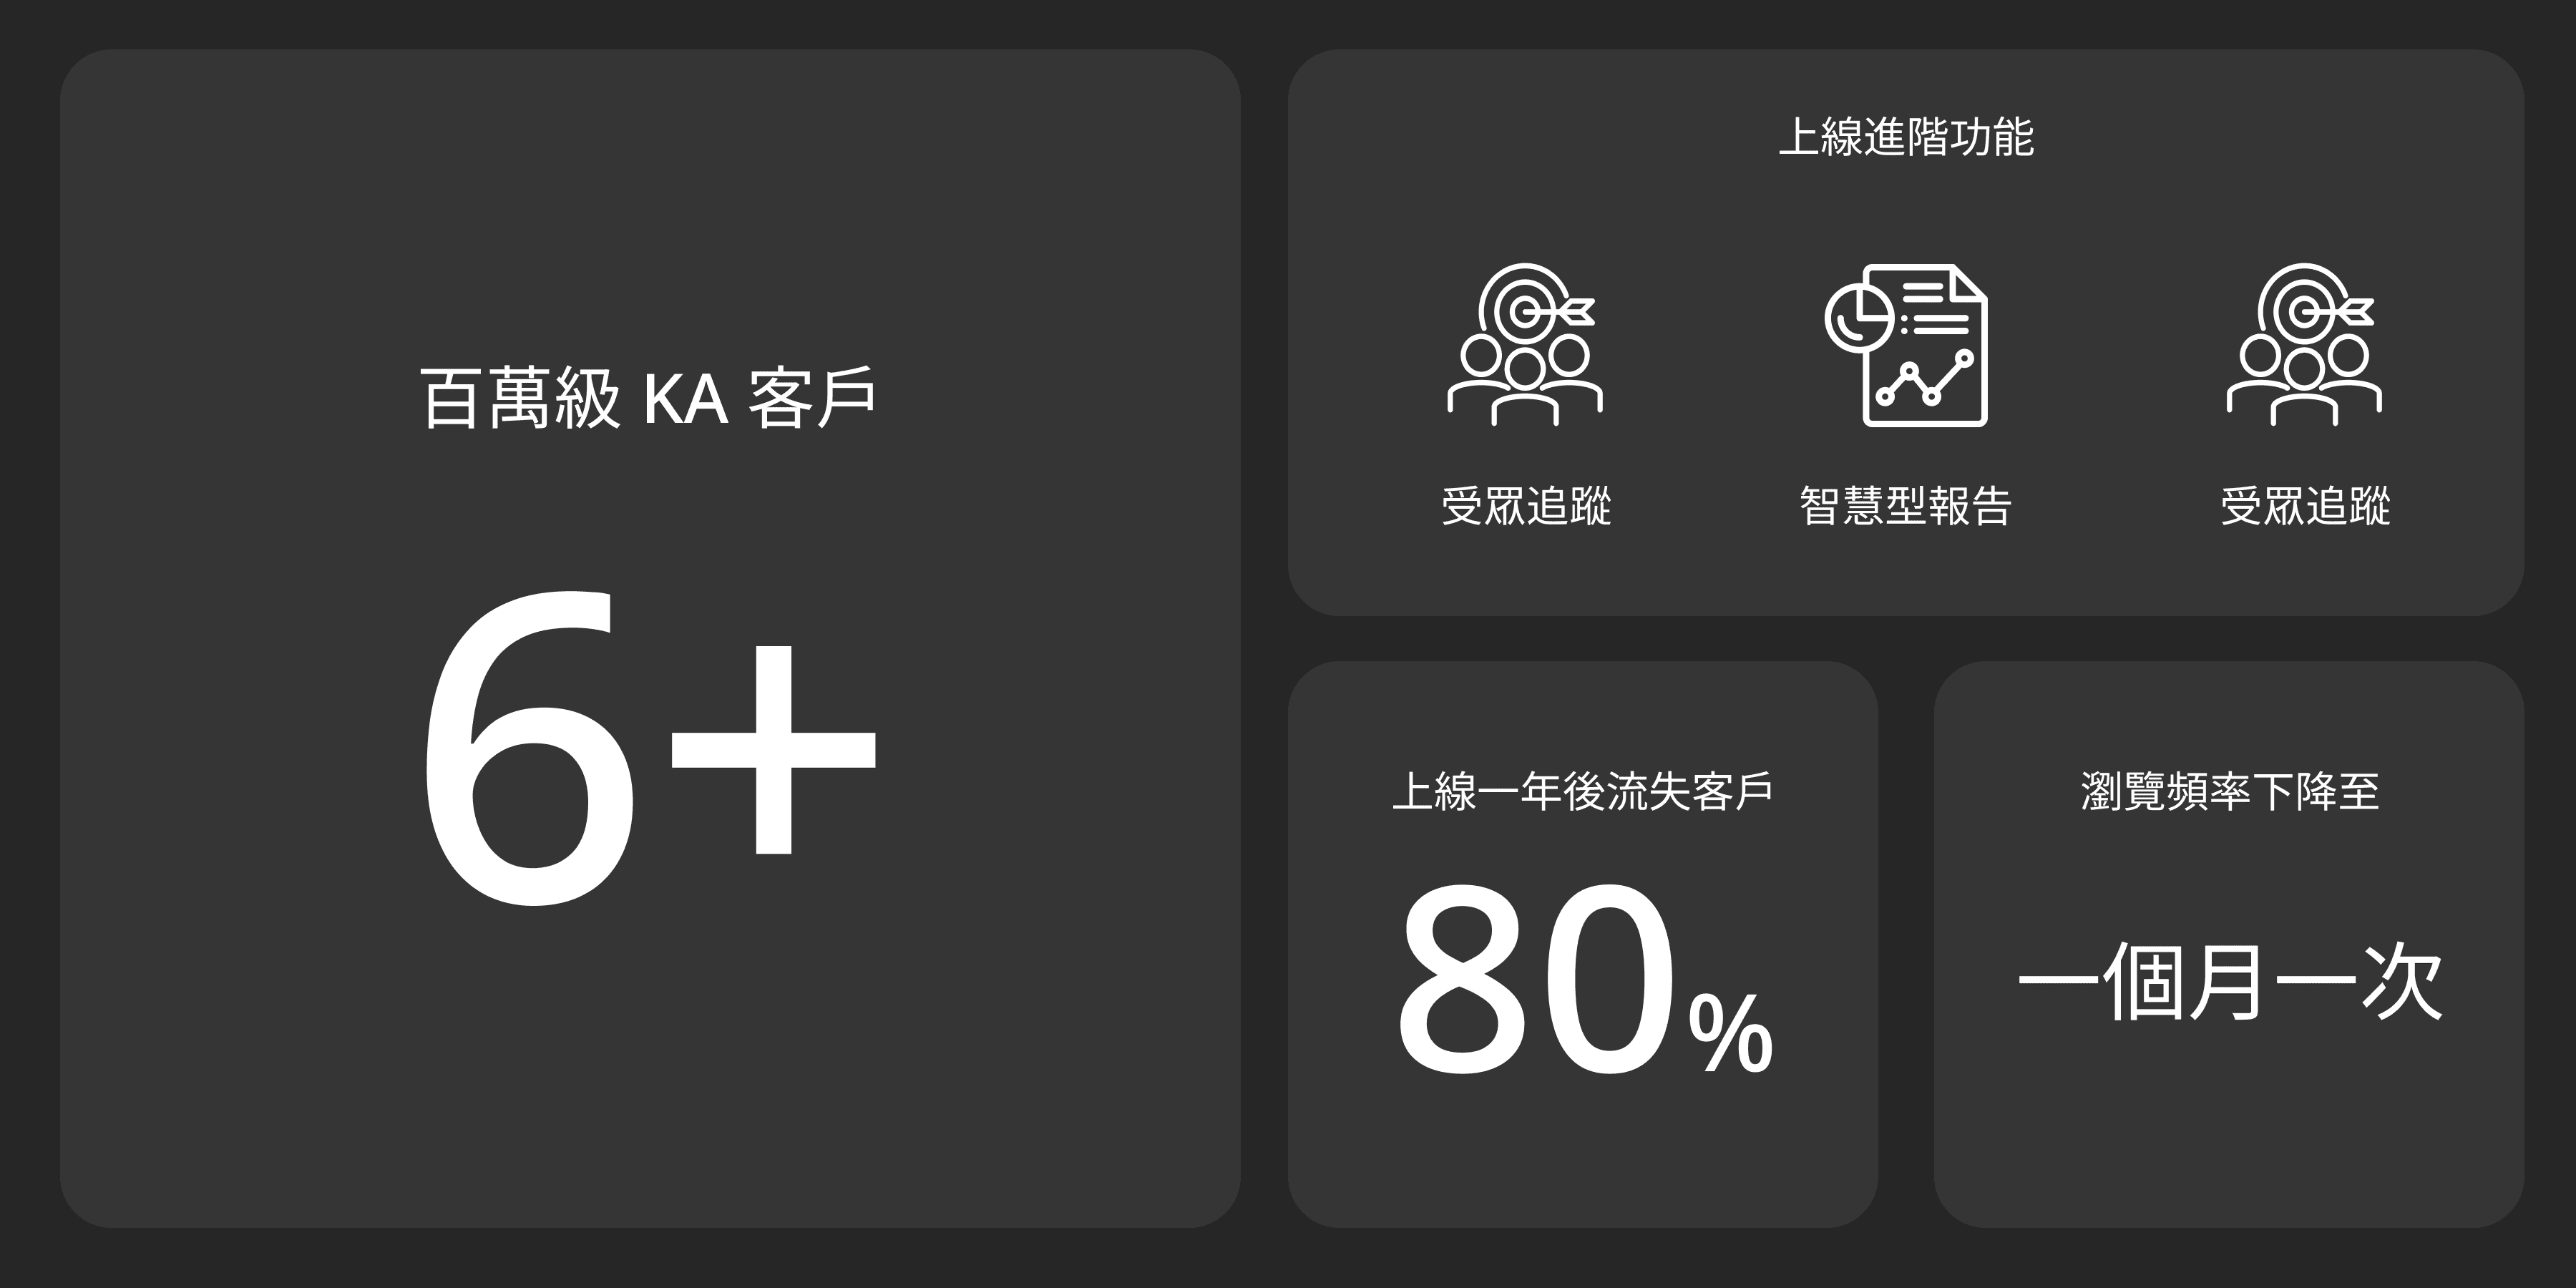
上線半年內,成功簽約6家百萬級客戶,系統圖表也被整合到客戶的月報中。後續上線受眾追蹤、智慧型報告等進階功能希望建立品牌壁壘。但上線一年後第一批系統客戶流失近八成,平均使用頻率從一週一次下降至一個月一次,從數據後台很難直接獲取沒有續約的原因,B端客戶也很難直接接觸。
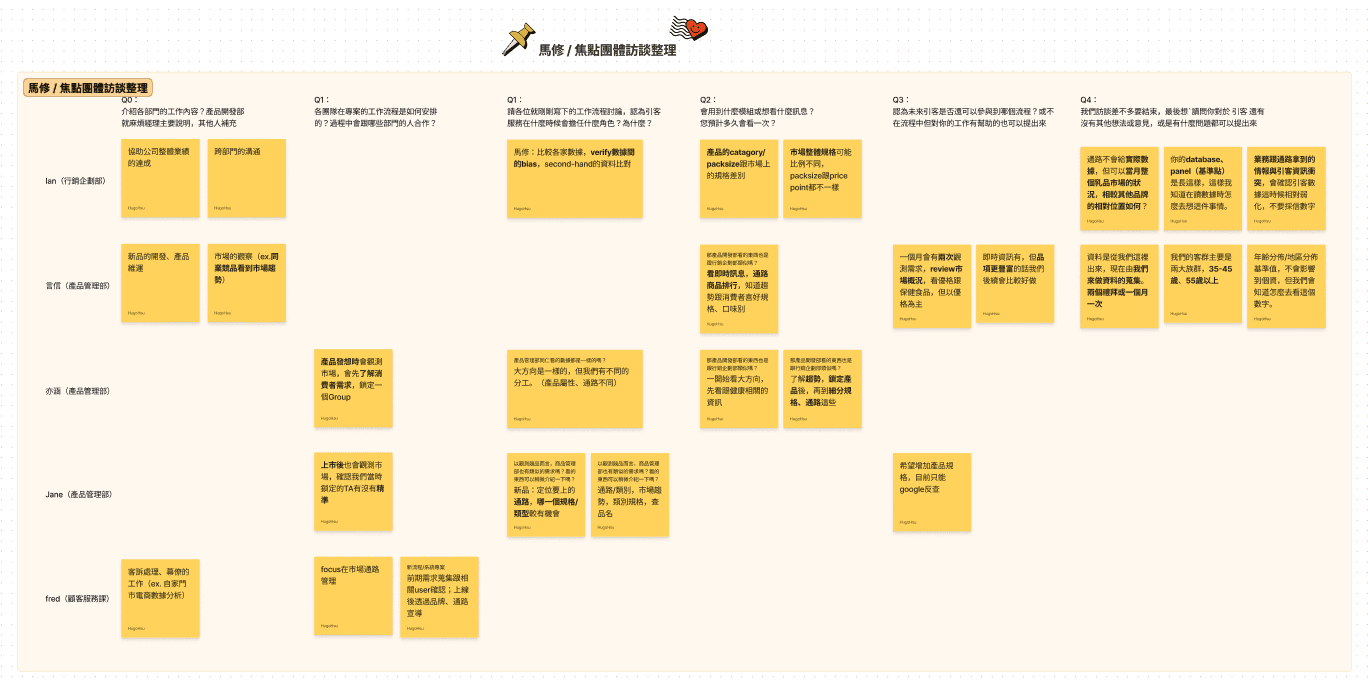
The team has decided to conduct user interviews with clients whose contracts are about to expire, including Matthew Selected and Uni-President Enterprises. Since the decision-makers in B-end clients are not necessarily the same as the actual users, this interview will mainly focus on actual users. We hope to understand the clients' daily workflows and how data affects their work. The interviews will be conducted using two methods: user interviews and focus groups, with a total of five sessions held.
Key information obtained from the interview and subsequent optimization directions

Customers all have the need to produce monthly/quarterly reports, and the data from guiding customers can help them better analyze phenomena.
Customers can feel the care that guiding customers put into the interface; the operation is very user-friendly and intuitive. However, sometimes the data may differ from their perceptions, leading to uncertainty about its reliability.
The operations logic for advanced features like audience tracking, chart deep dives, etc., is relatively complex, with a higher learning curve. But once sufficient training is provided, they can use it smoothly; however, the results may still differ from their perceived market trends.
The data backend assists customers in discovering the market's specifications demand transformation, helping them make proactive decision strategies.
While satisfaction with the interface and functionality is relatively high, the satisfaction with data accuracy is very low, which in turn affects the overall satisfaction negatively.
Although the features and interface meet customer needs, there is a significant gap between the data and customer perception, making it difficult to gain trust.
Through market feedback and user interviews, it can be confirmed that there is a demand for this product in the market. The provided features and platform do indeed assist customers in their work, and several users have expressed their preference for our interface operations. However, the core issue remains the data; in light of customers' doubts about data accuracy, it is difficult to persuade them to continue the contract.

11
Reflection and Learning

This has been a very compact and busy year, with every member of the team working hard for this product, producing many great results. Although we often had to race against delivery schedules, there were also many struggles and trade-offs. At the start of each project, the entire team needed to learn the relevant know-how together, discussing what methods could make user operations more efficient. How should we prepare for user interviews to obtain the information we need? Although later due to a shift in company direction, we stopped selling the system and switched to maintenance and internal use, this year and a half did successfully validate market demand, and it also allowed the whole team to gain further insights into data and market observation.
Get in Touch
hugohsu0401@gmail.com
© Hugo Hsu 2023 Copyright. All Rights Reserved.